── Attaching core tidyverse packages ──────────────────────── tidyverse 2.0.0 ──
✔ dplyr     1.1.2     ✔ readr     2.1.4
✔ forcats   1.0.0     ✔ stringr   1.5.0
✔ lubridate 1.9.2     ✔ tibble    3.2.1
✔ purrr     1.0.1     ✔ tidyr     1.3.0
── Conflicts ────────────────────────────────────────── tidyverse_conflicts() ──
✖ dplyr::filter() masks stats::filter()
✖ dplyr::lag()    masks stats::lag()
ℹ Use the conflicted package (<http://conflicted.r-lib.org/>) to force all conflicts to become errors
library(scales)
Attaching package: 'scales'

The following object is masked from 'package:purrr':

    discard

The following object is masked from 'package:readr':

    col_factor
library(plotly)
Attaching package: 'plotly'

The following object is masked from 'package:ggplot2':

    last_plot

The following object is masked from 'package:stats':

    filter

The following object is masked from 'package:graphics':

    layout
library(ggiraph)
median_income <-get_acs(geography ="county",variables ="B19013_001",state ="IA", year =2021)
Getting data from the 2017-2021 5-year ACS
Warning: • You have not set a Census API key. Users without a key are limited to 500
queries per day and may experience performance limitations.
ℹ For best results, get a Census API key at
http://api.census.gov/data/key_signup.html and then supply the key to the
`census_api_key()` function to use it throughout your tidycensus session.
This warning is displayed once per session.
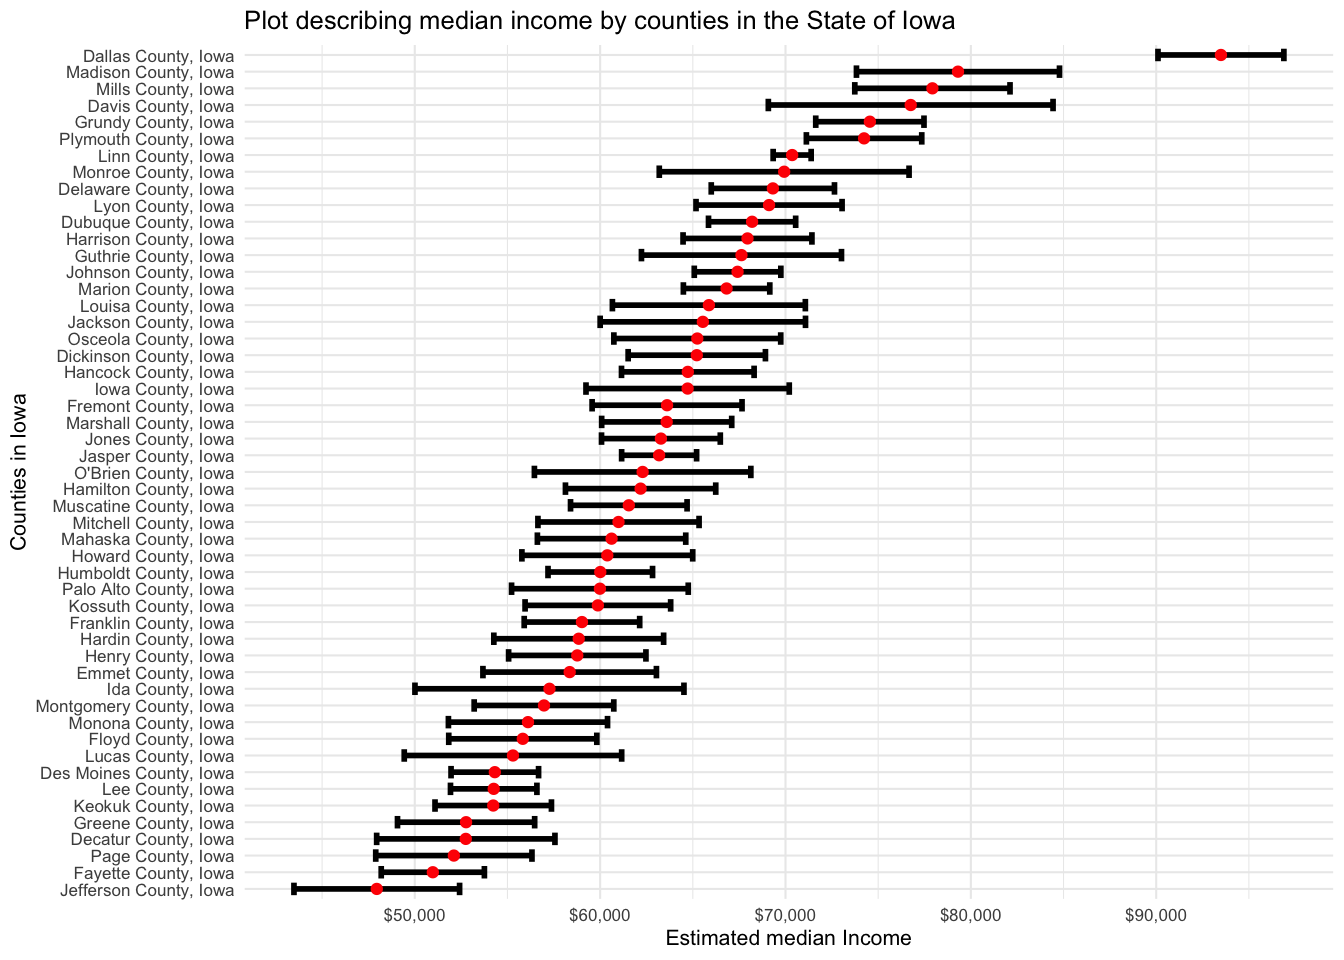
medinc_data <- median_income %>%#reducing the number of countys the graph can displayslice(floor(99*0.25):floor(99*0.75)+1) %>%#ordering from estimate highest to estimate lowestarrange(desc(estimate))
median_barplot <-ggplot(medinc_data, aes(x = estimate, y =reorder(NAME, estimate),tooltip = estimate,data_id = GEOID)) +geom_errorbar(aes(xmin = estimate - moe, xmax = estimate + moe),width =0.75, size =1) +geom_point_interactive(color ="red", size =1.5) +scale_x_continuous(labels =label_dollar()) +labs(title ="Plot describing median income by counties in the State of Iowa",x ="Estimated median Income",y ="Counties in Iowa") +theme_minimal(base_size =8)
Warning: Using `size` aesthetic for lines was deprecated in ggplot2 3.4.0.
ℹ Please use `linewidth` instead.
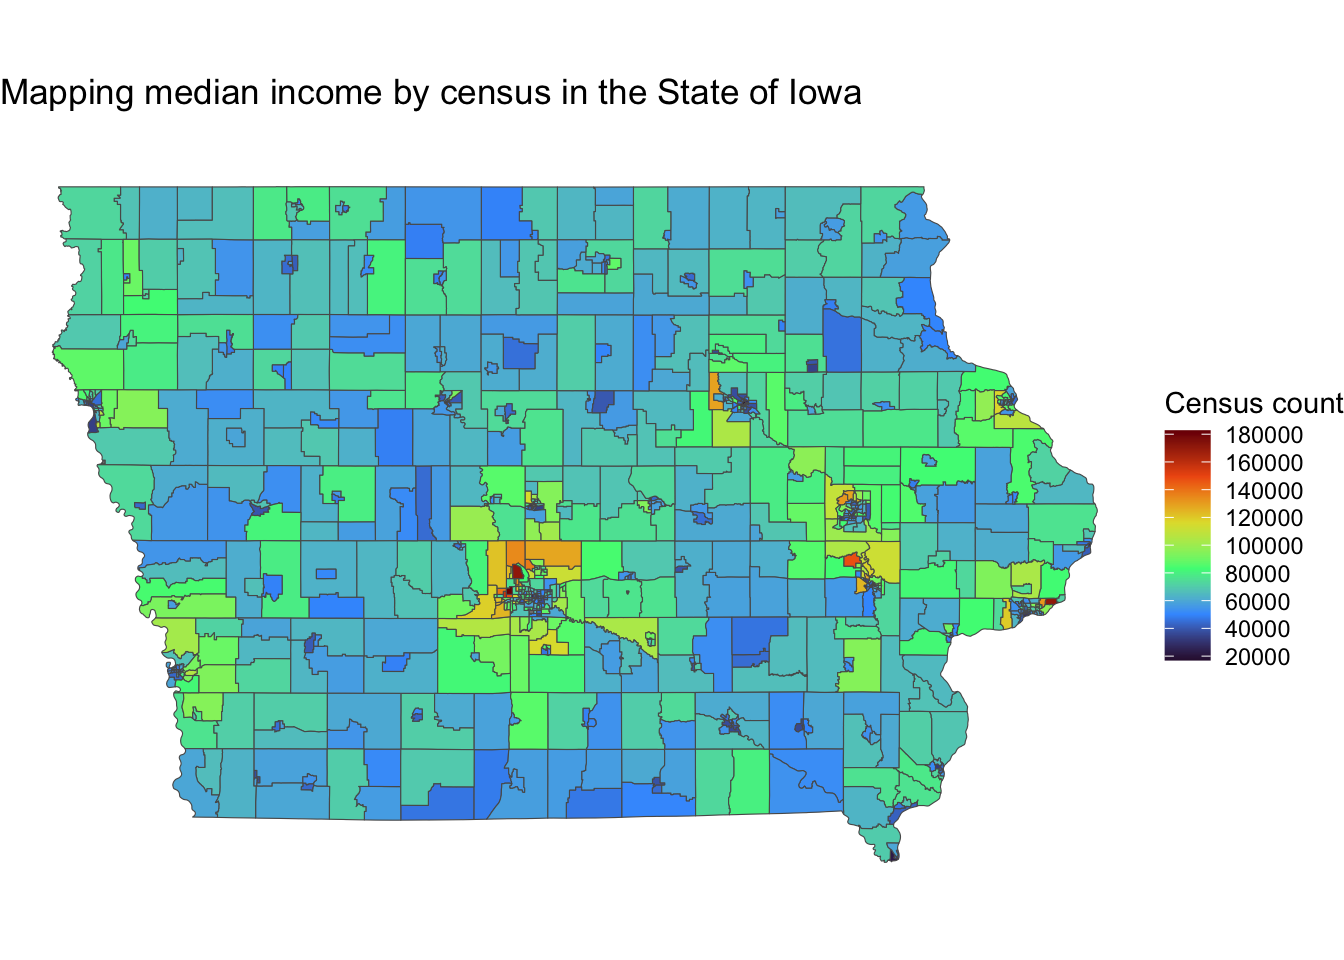
median_map <-ggplot(mapping_median, aes(fill = estimate)) +geom_sf() +theme_void() +scale_fill_viridis_c(option ="H", n.breaks =10) +labs(title ="Mapping median income by census in the State of Iowa",subtitle ="",fill ="Census count")median_barplot
median_map
Also worked on completing DataCamp courses and added on more than 10000 XP.